Launching and Debugging
Introduction
The OMNeT++ IDE allows you to execute single simulations and simulation batches, as well as debug and, to some extent, profile simulations. You can choose whether you want the simulation to run in graphical mode (using Qtenv) or in console mode (using Cmdenv); which simulation configuration and run number to execute; whether to record an eventlog or not; and many other options.
When running simulation batches, you can specify the number of processes allowed to run in parallel, so you can take advantage of multiple processors or processor cores. The progress of the batch can be monitored, and you can also terminate processes from the batch if needed. Batches are based on the parameter study feature of INI files; you can read more about it in the OMNeT++ Simulation Manual.
Debugging support comes from the Eclipse C/C++ Development Toolkit (CDT), and beyond the basics (such as single-stepping, stack trace, breakpoints, watches, etc.), it also offers several conveniences and advanced functionality such as inspection tooltips, conditional breakpoints, and more. Debugging with CDT also has extensive literature on the Internet. Currently, CDT uses the GNU Debugger (gdb) as the underlying debugger.
Profiling support is based on the valgrind program, available at http://valgrind.org. Valgrind is a suite of tools for debugging and profiling on Linux. It can automatically detect various memory access and memory management bugs, and perform a detailed profiling of your program. Valgrind support is brought into the OMNeT++ IDE by the Linux Tools Project of Eclipse.
Launch Configurations
Eclipse, and therefore the IDE as well, uses launch configurations to store the details of the program to be launched: which program to run, the list of arguments and environment variables, and other options. Eclipse and its C/C++ Development Toolkit (CDT) already come with several types of launch configurations (e.g., “C/C++ Application”), and the IDE adds OMNeT++ Simulation. The same launch configuration can be used with the Run, Debug, and Profile buttons.
Running a Simulation
Quick Run
The simplest way to launch a simulation is by selecting a project, folder, INI, or NED file in Project Explorer and clicking the Run button on the toolbar. This will create a suitable launch configuration (if one does not already exist) and start the simulation. Alternatively, you can choose the option from the context menu.
Details:
If a folder is selected and it contains a single INI file, the IDE will use that file to start the simulation.
If an INI file is selected, it will be used as the main INI file for the simulation.
If a NED file is selected (containing a network definition), the IDE will search for INI files in the active projects and try to find a configuration that allows the network to start.
The Run Configurations Dialog
Launch configurations can be managed in the Run Configurations dialog. (Two other dialogs, Debug Configurations and Profile Configurations, are very similar and allow you to manage debugging/profiling aspects of launch configurations).
The Run Configurations dialog can be opened in various ways: via the main menu (), via the context menu of a project, folder, or file (), via the green Run toolbar button ( item in its attached menu, or by Ctrl-clicking any other menu item or the toolbar button itself).
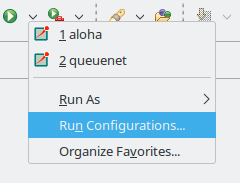
Fig. 85 One way to open the Run Configurations dialog
Creating a Launch Configuration
The OMNeT++ IDE adds a new Eclipse launch configuration type, OMNeT++ Simulation, that supports launching simulation executables. To create a new run configuration, open the Run Configurations dialog. In the dialog, select OMNeT++ Simulation from the tree and click the New launch configuration icon in the top-left corner. A blank launch configuration will be created, where you can give it a name at the top of the form.
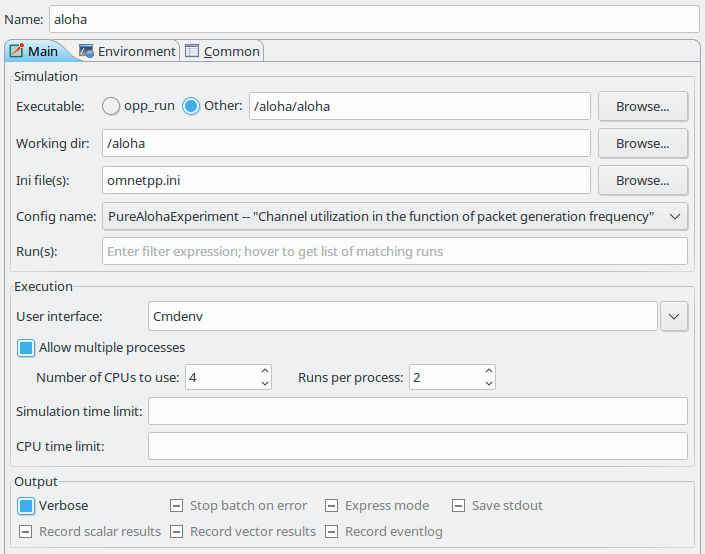
Fig. 86 The Simulation Launcher
The Main tab of the configuration dialog is designed to make the launching of simulations as easy as
possible. The only required field is Working directory; all others have defaults. If you only select the
working directory and the simulation program, it will start the first configuration from the omnetpp.ini file in the
specified working directory.
Tip
Hover your mouse over the controls in this dialog to receive tooltip help for the selected control.
Note
The Launch dialog will try to figure out your initial settings automatically. If you select an INI file in the Project Explorer View, or the active editor contains an INI file before launching the Run dialog, the INI file and working directory fields will be automatically populated for you. The dialog will also try to guess the executable name based on the settings of your currently open projects.
Executable: You must set the name of the simulation executable here. This is a workspace path. You may use the Browse button to select the executable directly. If your project output is a shared library, select opp_run. This will cause the IDE to use the opp_run or opp_run_dbg helper executable with the
-loption to run the simulation. Make sure that the Dynamic Libraries field in the advanced section contains the libraries you want to load.Working directory: Specifies the working directory of the simulation program. This is a workspace path. Note that values in several other fields in the dialog are treated as relative to this directory, so changing the working directory may invalidate or change the meaning of previously selected entries in other fields of the dialog.
Initialization file(s): You should specify one or more INI files that will be used to launch the simulation. The default is
omnetpp.ini. Specifying more than one file (separated by space) will cause the simulation to load all those files in the specified order.Config name: Once you specify a valid INI file, this box will display all the Config sections in that file. In addition, it will display the description of each section and the information regarding which Config section is extended by it. You can select which Configuration to launch.
Note
The working directory and the INI file must contain valid entries before setting this option.
Runs: You can specify which run(s) to execute for the simulation. An empty field corresponds to all runs. You can specify run numbers or a filter expression that refers to iteration variables. Use commas and the
..operator to separate the run numbers; for example,1,2,5..9,20corresponds to run numbers 1,2,5,6,7,8,9,20. You can also specify run filters, which are boolean expressions involving constants and iteration variables (e.g.,$numHosts>5 and $numHosts<10). Running several simulations in this manner is called batch execution.Tip
If the executable name and the INI file have already been selected, hover the mouse over the field to get the list of matching runs.
User interface: You can specify which UI environment should be used during execution. The dialog offers Cmdenv (command-line UI) and Qtenv (Qt-based GUI). If you have a custom user interface, you can also specify its name here. Make sure that the code of the chosen UI library is available (linked into the executable/library or loaded dynamically).
Note
Batch execution and progress feedback during simulation are only supported when using Cmdenv.
- Allow multiple processes: With batch execution, you can tell the launcher to keep two or more
simulations running at a time or to start a new simulation process after a certain number of runs have been executed. This way, you can take advantage of multiple CPUs or CPU cores. You can set the number of CPUs to use and the number of runs to execute in a single process.
Warning
Only use this option if your simulation is CPU-limited and you have enough physical RAM to support all of the processes at the same time. Do not set it higher than the number of physical processors or cores you have in your machine.
Simulation time limit and CPU time limit can also be set to limit the runtime length of the simulation from the launch dialog, in case those were not set in the INI file.
Output options: Various options can be set regarding simulation output. These checkboxes may be in one of three states: checked (on), unchecked (off), and grayed out (unspecified). When a checkbox is grayed out, the launcher lets the corresponding configuration option from the INI file take effect.
Clicking on the More >>> link will reveal additional controls.
Dynamic libraries: A simulation may load additional DLLs or shared libraries before execution, or your entire simulation may be built as a shared library. The Browse button is available to select one or more files (use Ctrl + click for multiple selection). This option can be used to load simulation code (i.e., simple modules), user interface libraries, or other extension libraries (scheduler, output file managers, etc.). The special macro
${opp_shared_libs:/workingdir}expands to all shared libraries provided by the current project or any other project on which you currently depend.Note
If your simulation is built as a shared library, you must use the opp_run stub executable to start it. opp_run is basically an empty OMNeT++ executable that understands all command line options but does not contain any simulation code.
Warning
If you use external shared libraries (i.e., libraries other than the ones provided by the current open projects or OMNeT++ itself), ensure that the executable part has access to the shared library. On Windows, you must set the
PATHenvironment variable, while on Linux and Mac, you must set theLD_LIBRARY_PATHenvironment variable to point to the directory where the DLLs or shared libraries are located. You can set these variables either globally or in the Environment tab of the Launcher Configuration Dialog.NED Source Path: The directory or directories where the NED files are read from.
Tip
The variable
${opp_ned_path:/workingdir}refers to an automatically computed path (derived from project settings). If you want to add additional NED folders to the automatically calculated list, use the${opp_ned_path:/workingdir}:/my/additional/pathsyntax.Image path: A path that is used to load images and icons in the model.
Additional arguments: Other command-line arguments can be specified here and will be passed to the simulation process.
Build before launch: This section allows you to configure the behavior of automatic build before launching. The build scope can be set to this project and all its dependencies, this project only, or you can turn off autobuild before launch. The active configuration switching during the build can also be configured here (Ask, Switch, Never switch).
Related Command-Line Arguments
Most settings in the dialog correspond to command-line options for the simulation executable. Here is a summary:
Initialization files: maps to multiple
-f <inifile>options.Configuration name: adds a
-c <configname>option.Run number: adds a
-r <runnumber/filter>option.User interface: adds a
-u <userinterface>option.Dynamically loaded libraries: maps to multiple
-l <library>options.NED source path: adds a
-n <nedpath>option.
Debug vs. Release Launch
The launcher automatically determines whether to start the release or debug build of the model. When running,
release-mode binaries are used automatically. For debugging, debug builds are started (i.e., those with a binary name ending
with the _dbg suffix). Before starting the simulation, the launcher checks if the binary is up to date and triggers a
build process (and also changes the active configuration) if necessary.
Batch Execution
OMNeT++ INI files allow you to run a simulation several times with different parameters. You can specify loops or conditions for specific parameters.

Fig. 87 Iteration variable in the INI file
Note
Batch running is supported only in the command-line environment.
If you create an INI file configuration (a [Config] section) with one or more iteration variables, you will be able to run
your simulations and explore the parameter space defined by those variables. Basically, the IDE creates the Cartesian
product from these variables and assigns a run number to each combination. To execute one, several, or all
runs of the simulation, you can specify the Run number field in the Run Dialog. You can specify a
single number (e.g., 3), a combination of several numbers (e.g., 2,3,6,7..11), all run numbers (using *), or
a boolean expression using constants and iteration variables (e.g., $numHosts>5 and $numHosts<10).
Tip
If you have already specified your executable, selected the configuration to be run, and chosen the command
line environment, you can hover over the Run number field. This will give you a description of the
possible runs and how they are associated with the iteration variable values (the tooltip is calculated by executing
the simulation program with the -x Configuration -G options in command line mode).
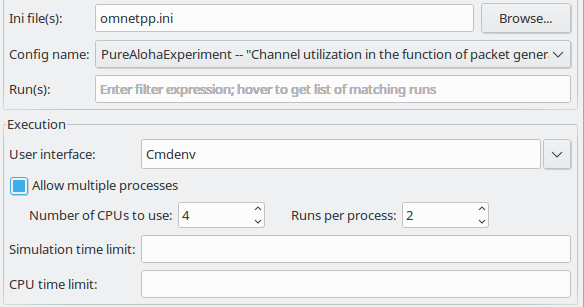
Fig. 88 Iteration loop expansion in a tooltip
If you have a multi-core or multi-processor system and sufficient memory, you can set the Processes to run parallel field to a higher number. This will allow the IDE to start more simulation processes in parallel, resulting in a much lower overall simulation time for the whole batch.
Warning
Be aware that you need enough memory to run all these processes in parallel. We recommend using this feature only if your simulation is CPU-bound. If you do not have enough memory, your operating system may start using virtual memory, dramatically decreasing the overall performance.
Debugging a Simulation
The OMNeT++ IDE integrates with the CDT (C/C++ Development Tooling) of Eclipse, which includes debugging support as well. The CDT debugger UI relies on gdb to do the actual work.
Starting a Debug Session
Launching a simulation in debug mode is very similar to running it (see previous sections), except you need to select the
Debug toolbar icon or menu item instead of Run. The same launch configurations used for
running are used for debugging, so if you open the Debug Configurations dialog, you will see the same
launch configurations as in the Run dialog. The launcher automatically uses the debug build of the model
(i.e., the executable with a _dbg suffix). The dialog will have extra tab pages where you can configure the
debugger and other details.
Note
If you have problems starting the debug session, check the following:
Ensure that your executable is built with debug information.
Verify that you can run the same executable without any issues (using the same launch configuration, but with the addition of a
_dbgsuffix to the executable name).Make sure the debugger type is set correctly on the Debugger tab of the Launch dialog.
Warning
Batch (and parallel) execution is not possible in this launch type, so you can only specify a single run number.
Using the Debugger
The CDT debugger provides functionality that can be expected from a good C/C++ debugger: run control (run, suspend, step into, step over, return from function, drop to stack frame), breakpoints (including conditional and counting breakpoints), watchpoints (expression breakpoints that stop the execution whenever the value of a given expression changes), and watching and inspecting variables. Access to machine-level details such as disassembly, registers, and memory is also available.
Source code is shown in the editor area, and additional information and controls are displayed in various Views such as Debug, Breakpoints, Expressions, Variables, Registers, Memory, etc.
CDT’s conversation with gdb can also be viewed in the appropriate pages of the Console View. (Click the Display Selected Console icon and choose either gdb or gdb traces from the menu.)
Tip
If you have a pointer in the program that points to an array (of objects, etc.), you can have it displayed as an array too. In Variables, right-click the variable and choose Display As Array from the menu. You will be prompted for a start index and the number of elements to display.
More information on the debugger is available in the CDT documentation, which is part of the IDE’s Help system. See the C/C++ Development User Guide, chapter Running and debugging projects.
Pretty Printers
Many programs contain data structures whose contents are difficult to comprehend by looking at “raw” variables in the
program. One example is the std::map<T> class, which is essentially a dictionary but implemented with a binary tree,
making it practically impossible to figure out with a C++ debugger what data a concrete map instance contains.
The solution gdb offers to this problem is pretty printers. Pretty printers are Python classes that gdb invokes to
transform some actual data structure into something that is easier for humans to understand. The *.py files that
provide and register these pretty printers are usually loaded via gdb’s startup script, .gdbinit (or some
.gdbinit.py script, as gdb allows startup scripts to be written in Python too).
The OMNeT++ IDE includes pretty printers for container classes in the standard C++ library (such as std::map<T> and
std::vector<T>), as well as for certain OMNeT++ data types, such as simtime_t. These scripts are located
under misc/gdb/ in the OMNeT++ root directory. The IDE also supports project-specific pretty printers: if the
root folder of the debugged project contains a .gdbinit.py file, it will be loaded by gdb. (The project’s
.gdbinit.py file can then load further Python scripts, such as from an etc/gdb/ folder of the project.)
Pretty printer loading works as follows: the IDE invokes gdb with misc/gdb/gdbinit.py as the startup script
(for new launch configurations, the GDB command file field on the Debugger tab is set to
${opp_root}/misc/gdb/gdbinit.py). This script loads the pretty printers under misc/gdb, as well as the
project-specific pretty printers.
Tip
If you want to write your own pretty printers, refer to the gdb documentation. It is available online, for example, here: http://sourceware.org/gdb/current/onlinedocs/gdb/
Some pretty printers may occasionally interfere with the debugged program (especially if the program’s state is already corrupted by earlier errors). Therefore, at times, it may be useful to temporarily disable pretty printers. To prevent pretty printers from being loaded for a session, clear the GDB command file setting in the launch configuration. To disable them for a currently active debug session, switch to the gdb page in the Console and enter the following gdb command:
disable pretty-printer global
Or, to only disable OMNeT++-specific pretty printers (but leave the standard C++ library printers on):
disable pretty-printer global omnetpp;.*
Just-in-Time Debugging
The OMNeT++ runtime has the ability to launch an external debugger and attach it to the simulation process. You can configure a simulation to launch the debugger immediately on startup or when an error (runtime error or crash) occurs. This just-in-time debugging facility was primarily intended for use on Linux.
To enable just-in-time debugging, set the debugger-attach-on-startup or debugger-attach-on-error configuration
option to true. You can do this by adding the appropriate line to omnetpp.ini or specifying
--debugger-attach-on-startup=true in the Additional arguments field in the launch configuration dialog.
You can also configure the debugger command line.
Note
On some systems (e.g., Ubuntu), just-in-time debugging requires extra setup beyond installing an external debugger. See the Installation Guide for more details.
Profiling a Simulation on Linux
On Linux systems, the OMNeT++ IDE supports executing your simulation using the valgrind program. Running
your program with valgrind allows you to find memory-related issues and programming errors in your code. The simulation
will run in an emulated environment (much slower than normal execution speeds), but valgrind will generate a detailed
report when it finishes. The report is shown in a separate Valgrind View at the end of the simulation run.
The OMNeT++ IDE contains support only for the memcheck tool. If you want to use other tools
(cachegrind, callgrind, massif, etc.), you may try to install the full ‘Linux Tools Project’ from the Eclipse
Marketplace.
To start profiling, right-click on your project in the Project Explorer tree and select . Valgrind must already be installed on your system.
Note
Simulation executes considerably slower than a normal run. Prepare for long run times or limit the simulation time in your .INI file. Statistical convergence is not required; just run long enough that all the code paths are executed in your model.
Controlling the Execution and Progress Reporting
After starting a simulation process or simulation batch, you can keep track of the started processes in the Debug View. To open the Debug View automatically during launch, check the “Show Debug View on Launch” option in the run configuration dialog, or select . Select a process and click the terminate button to stop a specific simulation run, or use the context menu for more options to control the process execution.
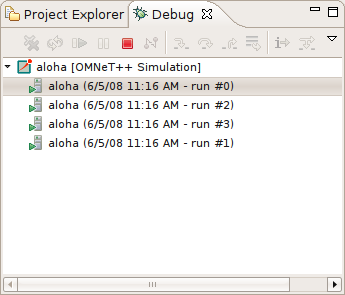
Fig. 89 Debug View
Tip
Place the Debug View in a different tab group than the console so you will be able to switch between the process outputs and see the process list at the same time.
Note
You can terminate all currently running processes by selecting the root of the launch. This will not cancel the entire batch, only the currently active processes. If you want to cancel the whole batch, open the Progress View and cancel the simulation batch there.
Clicking on a process in the Debug View switches to the output of that process in the Console View. The process may request user input via the console as well. Switch to the appropriate console and provide the requested parameters.
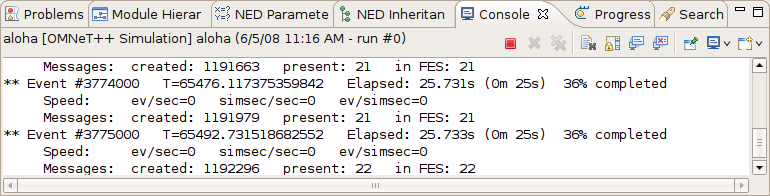
Fig. 90 Displaying the output of a simulation process in the Console View
Note
By default, the Console View automatically activates when a process writes to it. If you are running several parallel processes, this behavior might be inconvenient and prevent you from switching to the Progress View. You can turn off auto-activation by disabling the Show Console When Standard Out/Error Changes option in the Console View toolbar.
Progress Reporting
If you have executed the simulation in the command-line environment, you can monitor the progress of the simulation in the Progress View. See the status line for the overall progress indicator, and click on it to open the detailed progress view. You can terminate the entire batch by clicking on the cancel button in the Progress View.
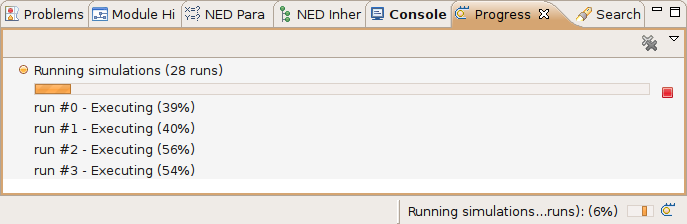
Fig. 91 Progress report on four parallel processes
Note
When the Progress View displays “Waiting for user input”, the simulation is waiting for user input. Switch to the appropriate console and provide the requested input for the simulation.
Note
If you need more frequent progress updates, set the cmdenv-status-frequency option in your INI file to a lower
value.