The Qtenv Graphical Runtime Environment
Qtenv is a graphical runtime interface for simulations. It supports interactive simulation execution, animation, inspection, tracing, and debugging. In addition to model development and verification, Qtenv is also useful for presentation and educational purposes, as it allows users to obtain a detailed picture of the simulation’s state and history at any point during execution.
Overview of the User Interface
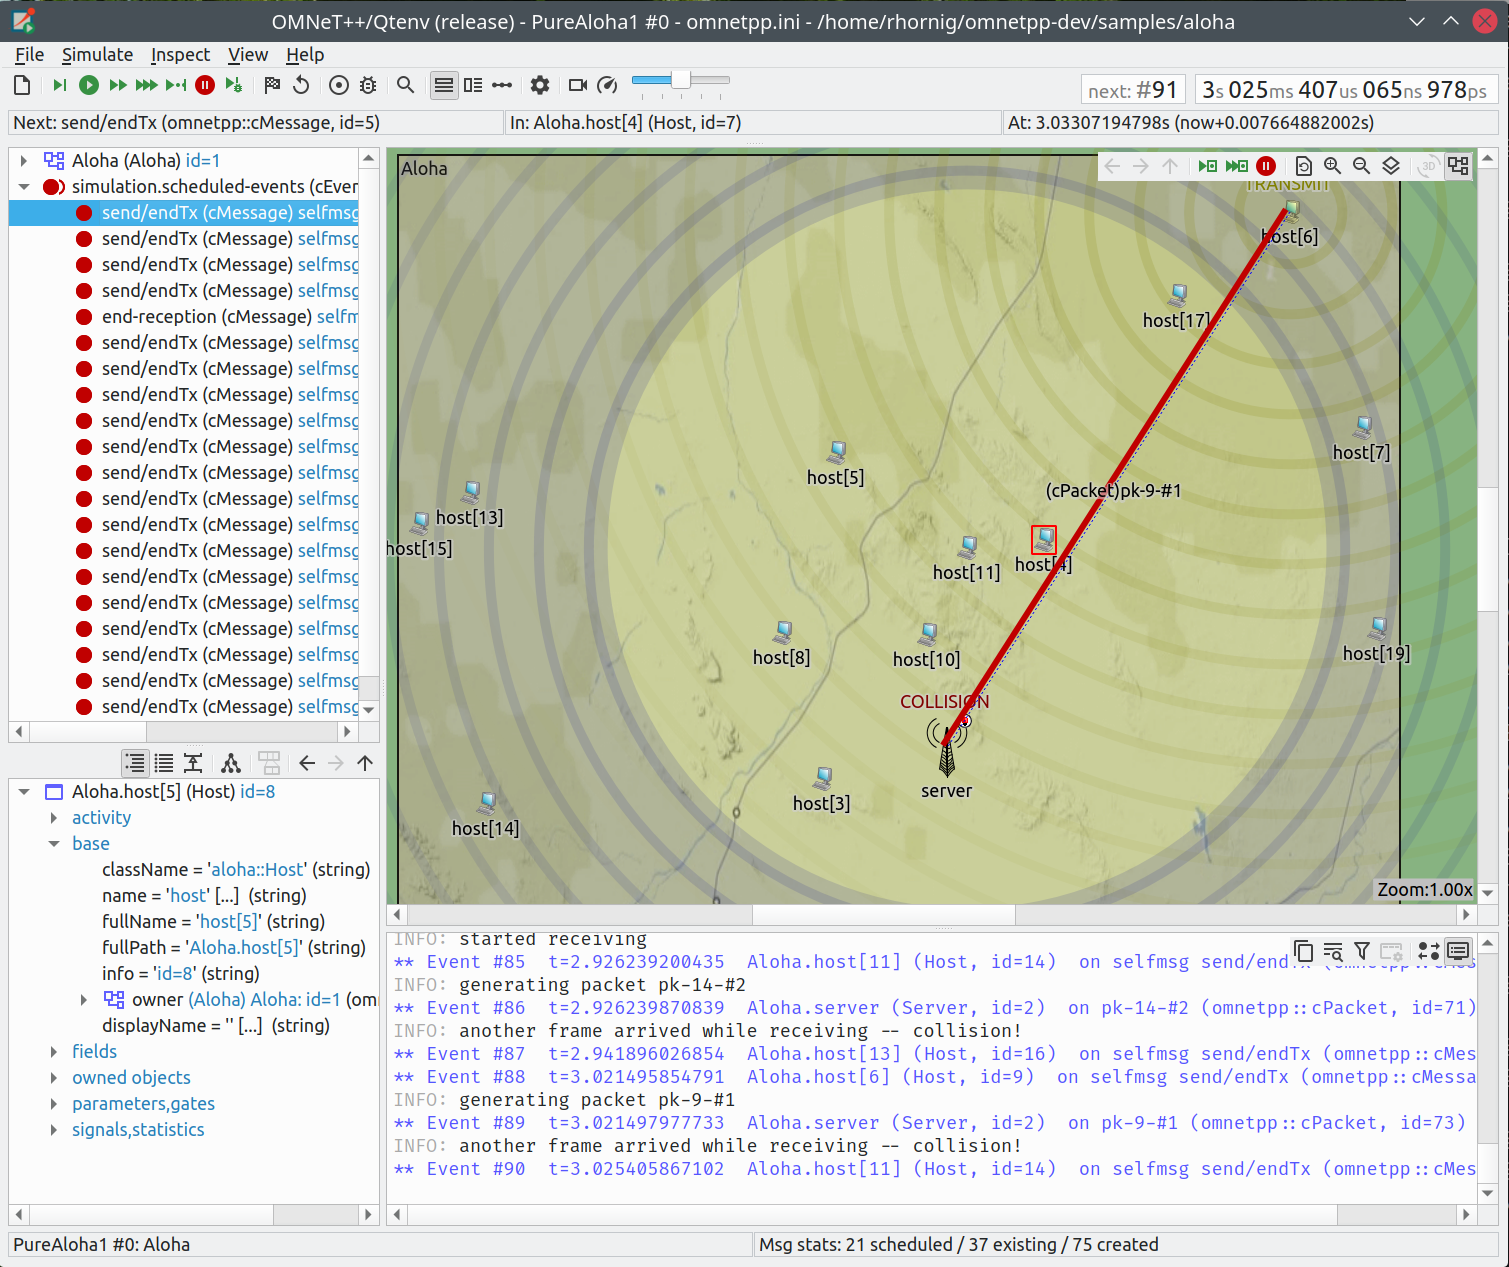
Fig. 92 The main window of Qtenv
The top of the window contains the following elements below the menu bar:
Toolbar: The toolbar provides access to the most frequently used functions, such as stepping, running, and stopping the simulation.
Animation speed: The slider at the end of the toolbar allows you to adjust the speed of both built-in animations and the playback speed of custom animations added by the model.
Event Number and Simulation Time: These two labels at the right end of the toolbar display the event number of the last executed or next future event, and the current simulation time. You can change the display format from the context menu.
Top status bar: Three labels in a row that display either information about the next simulation event (in Step and Normal mode), or performance data such as the number of events processed per second (in Fast and Express mode). This bar can be hidden to free up vertical space.
Timeline: Displays the contents of the Future Events Set (FES) on a logarithmic time scale. The timeline can be toggled off to free up vertical space.
Bottom status bar: Displays the current configuration, run number, and root module (network) name on the left, along with statistics about message objects in the model on the right.
The central area of the main window is divided into these regions:
Object Navigator: Displays the hierarchy of objects in the current simulation and in the FES.
Object Inspector: Displays the contents and properties of the selected object.
Network Display: Displays the network or any module graphically. This is also where animation takes place.
Log Viewer: Displays the log of packets or messages sent between modules, or log messages output by modules during simulation.
Additionally, you can open inspector windows that float on top of the main window.
Note
If you experience visual issues such as problematic colors that hinder using Qtenv, you can disable the platform integration style
plugins of Qt by setting the QT_STYLE_OVERRIDE environment variable to fusion. This makes widgets appear in a
platform-independent manner. For example, on Linux systems with certain desktop environments, you might encounter a
white-on-white color scheme; setting QT_STYLE_OVERRIDE to fusion will change the colors to a light gray
background with dark gray text.
Parts of the Qtenv UI
This section describes in detail the various parts of the Qtenv UI and how they function.
The Status Bars
The status bars show the simulation’s progress. There is one row at the top of the main window and one at the bottom. You can hide the top one using the menu item.

Fig. 93 The top status bar
When the simulation is paused or running with animation, the top row displays the next expected simulation event. Note the word expected. Certain schedulers may insert new events before the displayed event at the last moment. Schedulers that typically do this include those accepting input from outside sources: real-time schedulers, hybrid or hardware-in-the-loop schedulers, parallel simulation schedulers, etc. The top row contains:
Name, C++ class, and ID of the next message (event) object
The module where the next event will occur (i.e., the module where the message will be delivered)
The simulation time of the next (expected) simulation event
Time of the next event, and delta from the current simulation time
When the simulation runs in Fast or Express mode, displaying the next event becomes impractical. The contents of the top row are replaced by these performance gauges:

Fig. 94 The top status bar during Fast or Express run
Simulation speed: number of events processed per real second
Relative speed of the simulation (compared to real-time)
Event density: the number of events per simulated second
The bottom row contains these items:

Fig. 95 The bottom status bar
Ini config name, run number, and the name of the network
Message statistics: the number of messages currently scheduled (i.e., in the FES); the number of message objects that currently exist in the simulation; and the total number of message objects created so far, including those already deleted. Of these three, the middle one is typically the most useful. If it steadily grows without apparent reason, the simulation model is likely missing some
delete msgstatements and requires debugging.
The Timeline

Fig. 96 The timeline
The timeline displays the Future Events Set contents on a logarithmic time scale. Each dot represents a message (event). Messages scheduled for delivery at the current simulation time are grouped into a separate section on the left between brackets.
Clicking an event will focus it in the Object Inspector, and double-clicking it will open a floating inspector window. Right-clicking it will bring up a context menu with further actions.
The timeline is often crowded, limiting its usefulness. To address this, you can hide uninteresting events from the timeline. Right-click an event and choose Exclude Messages Like ‘x’ From Animation from the context menu. This hides events with a similar name and the same C++ class name from the timeline, and also skips animation when such messages are sent between modules. You can view and edit the excluded messages list on the Filtering page of the Preferences dialog. (Tip: the timeline context menu provides a shortcut to this dialog).
You can hide or reveal the entire timeline using the menu item, by pressing a button on the toolbar, or simply by dragging the separator handle beneath it all the way up.
The Object Navigator
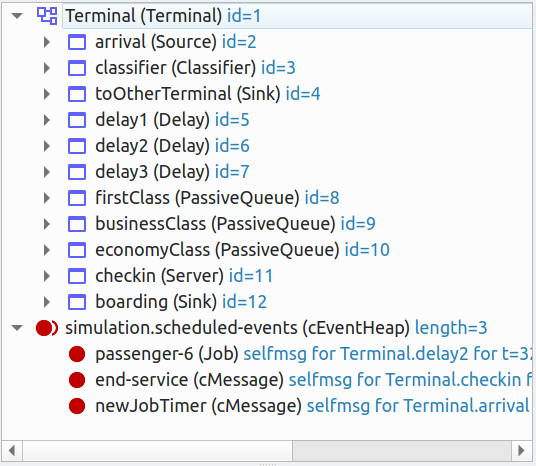
Fig. 97 The object tree
The Object Navigator displays the hierarchy of objects in the current simulation and in the FES in tree form.
Clicking an object will focus it in the Object Inspector, and double-clicking it will open a floating inspector window. Right-clicking it will bring up a context menu with further actions.
The Object Inspector
The Object Inspector is located below the Object Navigator and allows you to examine object contents in detail. The Object Inspector always focuses on the object last clicked or selected in the Qtenv UI. You can also navigate directly using the Back, Forward, and Go to Parent buttons, or by double-clicking objects shown within the inspector’s area.
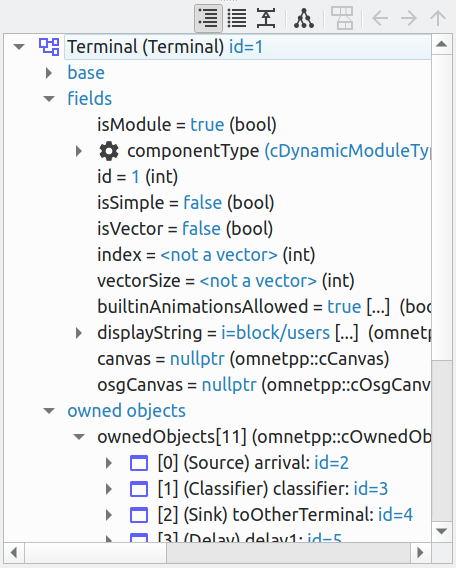
Fig. 98 The object inspector in Grouped mode¶ |
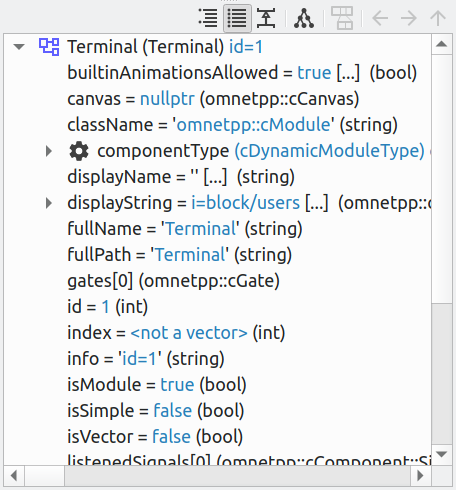
Fig. 99 The object inspector in Flat mode¶ |
The inspector offers four display modes: Grouped, Flat, Children, and Inheritance. Switch between these modes using the buttons on the inspector’s toolbar.
In Grouped, Flat, and Inheritance modes, the tree shows the object’s fields (or data members). It uses meta-information generated by the message compiler to obtain the field list and their values. (This applies even to built-in classes — the simulation kernel contains their msg format descriptions.)
The difference between these three modes is how fields are arranged. In Grouped mode, they are organized in categories; in Flat mode, they appear as a simple alphabetical list; and in Inheritance mode, they are organized according to which superclass they are inherited from.
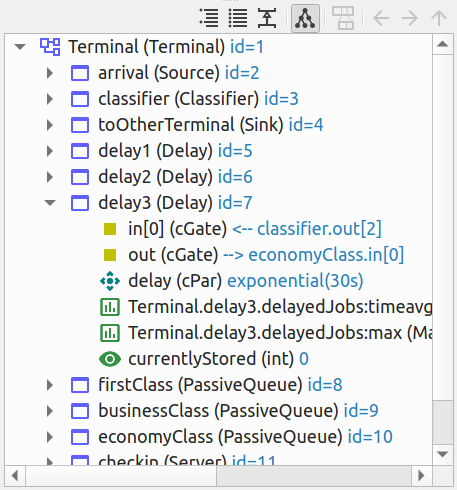
Fig. 100 The object inspector in Children mode¶ |
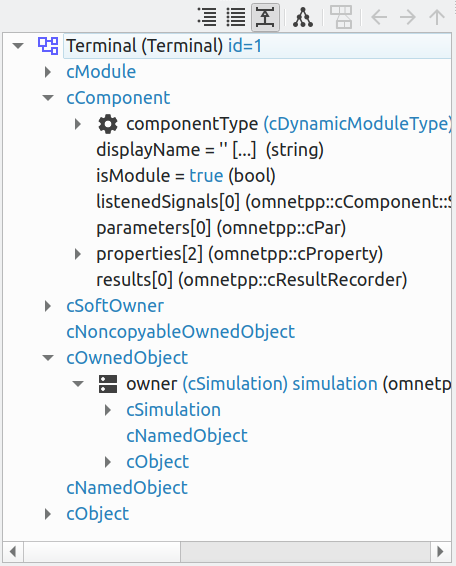
Fig. 101 The object inspector in Inheritance mode¶ |
In Children mode, the tree shows the child objects of the currently inspected object. The child list is
obtained via the object’s forEachChild() method. This is very similar to how the Object Navigator
works, but can have an arbitrary root.
The Network Display
The network view provides a graphical representation of the network and modules. The visualization is based on
display strings (@display properties in the NED file). You can navigate into any compound module by double-clicking its
icon.
Message sending, method calls, and various other events are animated in the graphical view. You can customize these animations in the Animation page of the Preferences dialog.
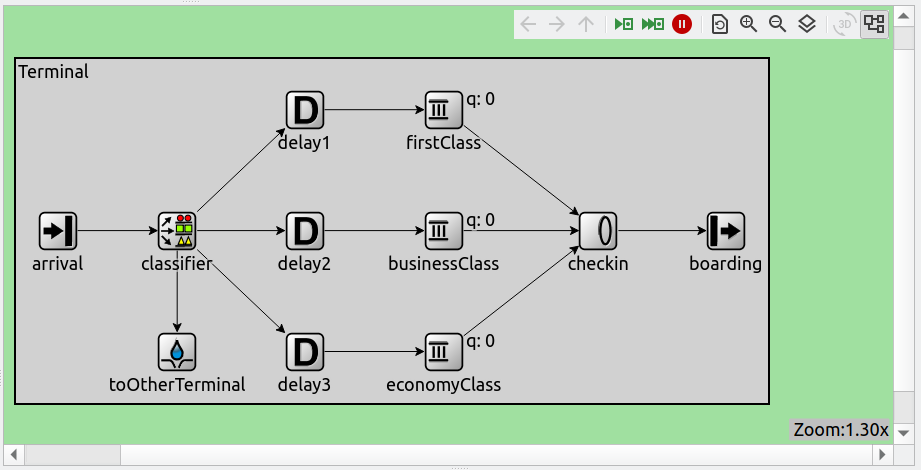
Fig. 102 The network display
The built-in cCanvas of the inspected object is rendered in this view alongside the module contents,
allowing custom annotations and animations to be overlaid. This canvas contains figures declared by the @figure
properties in the module’s NED source.
By selecting the Show/Hide Canvas Layers item in the inspected module’s context menu, you can filter the displayed figures based on their assigned tags.
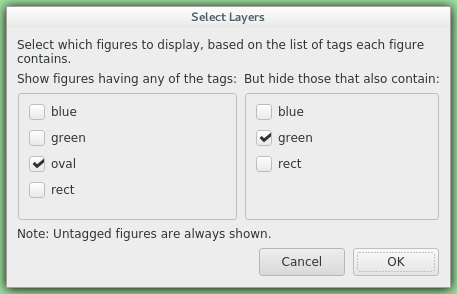
Fig. 103 Figure filtering dialog
Since figures can have multiple tags, a two-step filtering mechanism provides comprehensive control. The left side functions as a whitelist, while the right side serves as a blacklist. The example above would display only figures with the “oval” tag, except those that also have the “green” tag.
If the inspected module has a built-in cOsgCanvas (and Qtenv is built with OSG support enabled), this inspector can
be switched to 3D display mode using the globe icon on its toolbar. In this mode, the 2D network and canvas
display is replaced by the scene encapsulated in the cOsgCanvas.
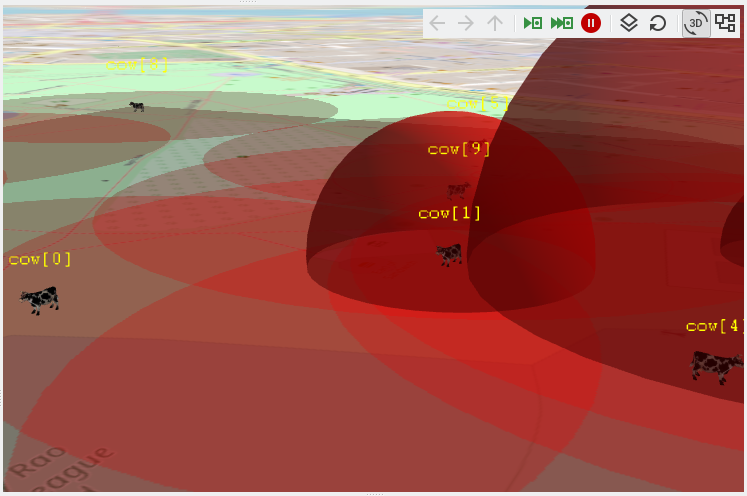
Fig. 104 The network display in 3D mode
The context menu of submodules provides further actions (see below).
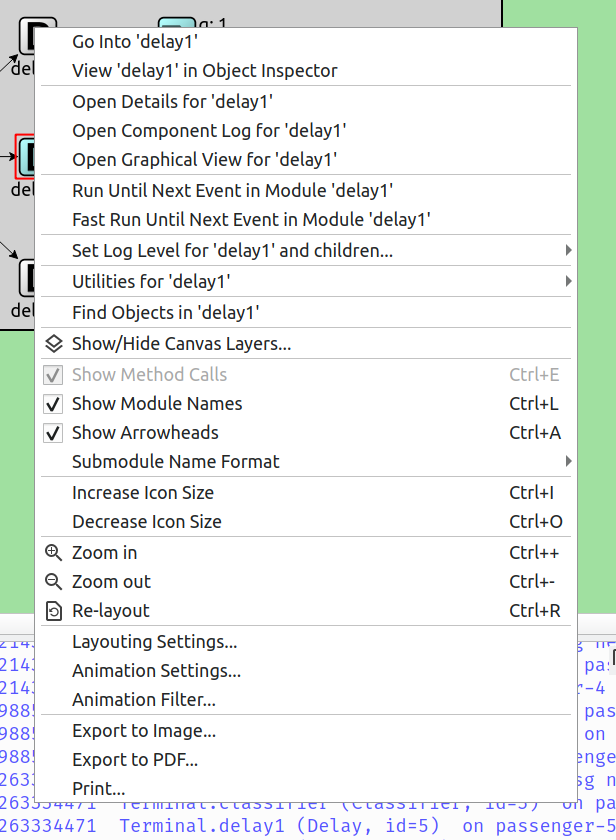
Fig. 105 Submodule context menu
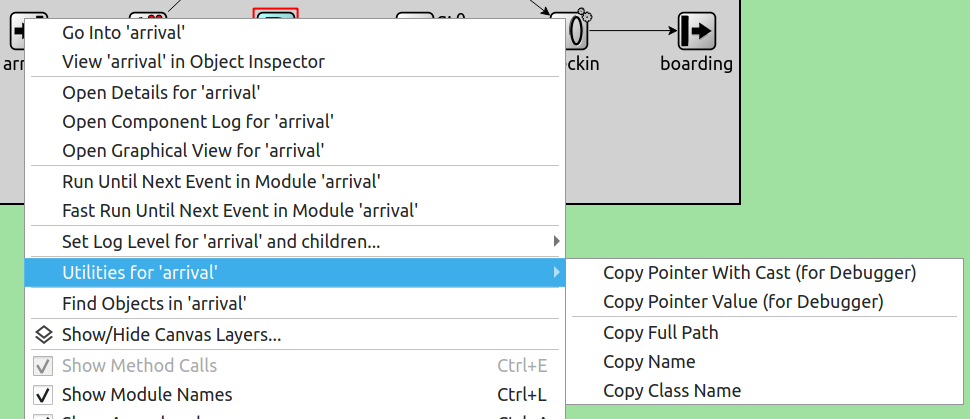
Fig. 106 The Utilities submenu
Zooming and Panning
You can zoom the canvas in several ways, using both mouse and keyboard:
To zoom in around a specific point, double-click the canvas; use Shift + double-click to zoom out, or scroll while holding down Ctrl.
You can also zoom around the viewport center using the magnifying glass buttons on the canvas toolbar.
For marquee zoom, drag a rectangle with the left mouse button while holding down Ctrl; cancel the operation with the right mouse button if needed.
Panning: move the mouse while holding down the left mouse button to reposition the canvas; this is often more comfortable than using scroll bars. You can also scroll in any direction using the mouse wheel or equivalent touchpad gestures.
The Log Viewer
When running the simulation, the Log Viewer allows you to review logs and message traffic from the simulation.
The Log Viewer offers two modes that you can toggle using the inspector’s local toolbar: Messages and Log mode.
In Messages mode, the window displays messages/packets sent locally in tabular format. Only messages sent between submodules of the inspected module and messages sent out of or into the module are shown. View details about any message in the Object Inspector by clicking on it, and access additional functions through its context menu. The simulation model can contribute columns by defining message printers (see the C++ section in this chapter).
In Log mode, the window displays log lines belonging to any module in the submodule tree of the inspected compound module. Logs are written by simulation modules using
EV,EV_INFO,EV_DETAIL, and other logging macros. Formatting via ANSI escape sequences is supported. Configure the log prefix using the Preferences dialog.
The embedded Log Viewer follows the module selection in the Network Display.
The Log Viewer provides useful tools including bookmarking, textual line filtering, and the Set Sending Time as Reference option that allows you to set a reference time and display all other times as deltas relative to it.
Logs are recorded only in Step, Run, and Fast Run modes. (Express mode achieves its speed by turning off such overhead while active.)
Only output from the last N events is preserved (N being configurable in the Preferences dialog); after this limit is reached, information from older events is discarded.
Note that you can also open additional Log Viewers as floating windows, allowing you to monitor logs from several modules simultaneously. To open a log window, locate the module in the module tree or network display, right-click it, and select Open Component Log from the context menu.
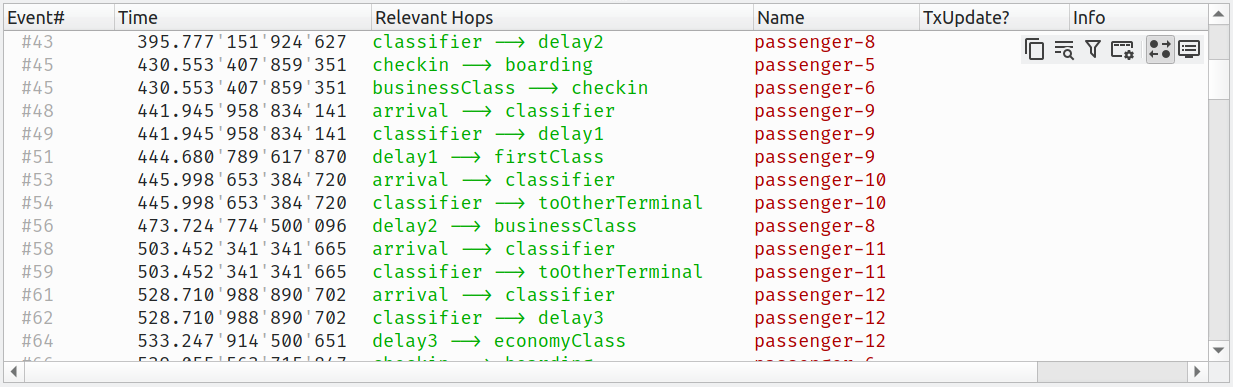
Fig. 107 The log viewer showing message traffic
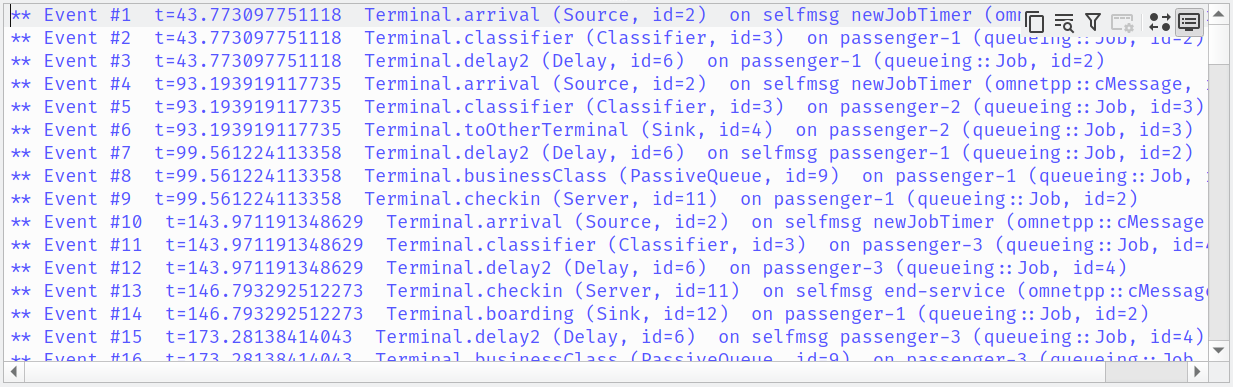
Fig. 108 The log viewer showing module log
You can filter the window content to include only messages from specific modules. Open the log window’s context menu and select Filter Window Contents.
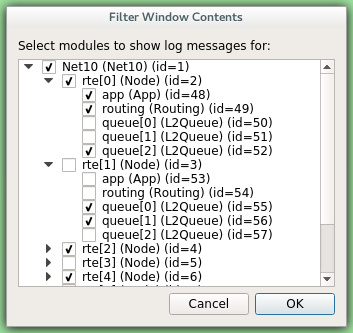
Fig. 109 The log filter dialog
General logging behavior, such as prefix format, can be configured in the Preferences dialog. The log level for each module (and its descendants) can be set through its context menu.
Using Qtenv
Starting Qtenv
When launching a simulation from the IDE, it starts with Qtenv by default. If it doesn’t, you can explicitly select Qtenv in the Run or Debug dialog.
Qtenv is also the default when starting the simulation from the command line. When necessary, you can force Qtenv by
adding the -u Qtenv switch to your command.
The complete list of command-line options, related environment variables, and configuration options can be found at the end of this chapter.
Setting Up and Running the Simulation
On startup, Qtenv reads the ini file(s) specified on the command line (or omnetpp.ini if none is specified) and
automatically sets up the simulation described in them. If multiple simulation configurations exist, Qtenv will
ask which one you want to set up.
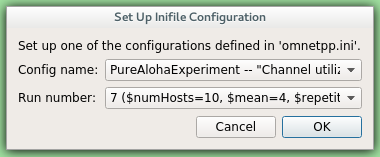
Fig. 110 Setting Up a New Simulation
Once a simulation is set up (modules created and initialized), you can run it in various modes and examine its state. You can restart the simulation at any time or set up a different simulation. If you quit Qtenv before the simulation finishes (or attempt to restart it), Qtenv will ask whether to finalize the simulation, which typically means saving summary statistics.
Functions for setting up a simulation are available in the File and Simulate menus, with the most important ones accessible via toolbar icons and keyboard shortcuts.
Some of these functions are:
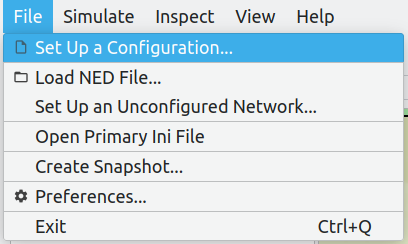
Fig. 111 The File menu
Set up a Configuration
This function lets you choose a configuration and run number from the ini file.
Open Primary Ini File
Opens the first ini file in a text window for viewing.
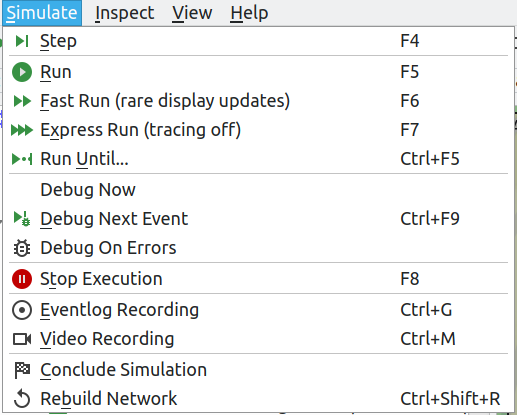
Fig. 112 The Simulate menu
Step
Step executes a single simulation event from the front of the FES. The next event is always shown on the status bar. The module where the next event will be delivered is highlighted with a red rectangle in the graphical display.
Run (or Normal Run)
In Run mode, the simulation runs with all tracing aids enabled. Message animation is active, and simulation time is interpolated if the model requested a non-zero animation speed. Inspector windows are continuously updated. Output messages appear in the main window and module output windows. Stop the simulation using the Stop button on the toolbar. You can fully interact with the user interface during simulation execution, including opening inspectors.
Note
If you find this mode too slow or distracting, you can disable animation features in the Preferences dialog.
Fast Run
In Fast mode, message animation is disabled and inspectors are updated less frequently. Fast mode is several times faster than Run mode; speed can increase by up to 10 times (or up to the configured event count).
Express Run
In Express mode, the simulation runs at approximately the same speed as with Cmdenv, with all tracing disabled. Module logs are not recorded. The simulation can only be interacted with occasionally, minimizing the runtime overhead of the user interface. UI updates can be completely disabled, requiring you to explicitly click the Update now button to refresh inspectors.
Run Until
You can run the simulation until a specified simulation time, event number, or until a specific message is delivered or canceled. This feature is particularly valuable during debugging sessions. You can also right-click an event in the simulation timeline and select Run until this event from the menu.
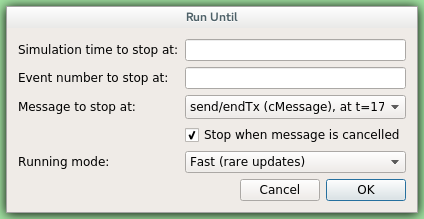
Fig. 113 The Run Until dialog
Run Until Next Event
You can also run until an event occurs in a specified module. Browse for the module and select Run until next event in this module. The simulation will stop when an event occurs in the selected module.
Conclude Simulation
This function finalizes the simulation by invoking the user-supplied finish() member functions on all module and
channel objects in the simulation. The typical implementation of finish() records summary statistics. The
simulation cannot be continued after this operation.
Rebuild Network
Rebuilds the simulation by deleting the current network and setting it up again. Improperly written simulations may crash when Rebuild Network is invoked, typically due to incorrectly implemented destructors in module classes.
Inspecting Objects
Inspecting Simulation Objects
Inspectors
The Network Display, Log Viewer, and Object Inspector in the main window share common properties: they display various aspects (graphical view, log messages, fields or contents) of a given object. These UI components are called inspectors in Qtenv.
The three inspectors mentioned above are built into the main window, but you can open additional ones as needed. These new inspectors appear in floating windows above the main window, and you can have any number open simultaneously.
Inspectors come in various types. They can be graphical like the network view, textual like the log viewer, tree-based like the object inspector, or something entirely different.
The screenshot below shows Qtenv with several inspectors open.
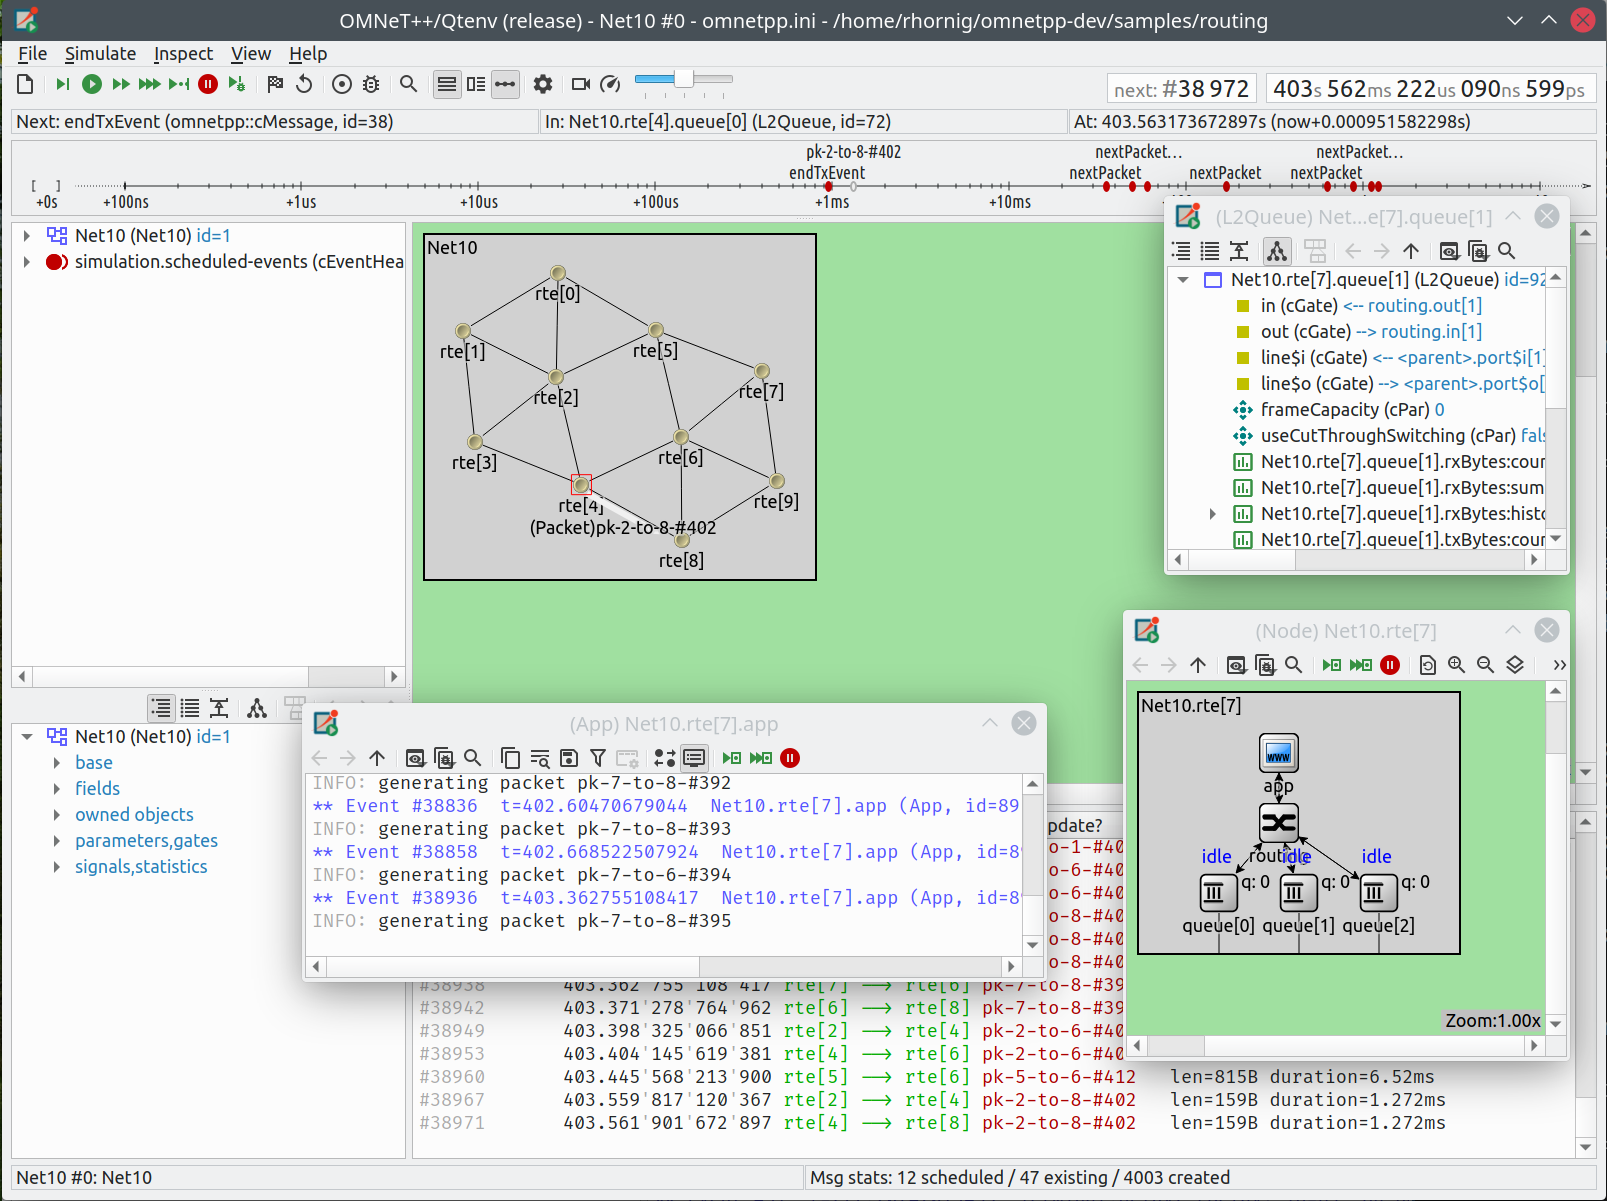
Fig. 114 Qtenv with several floating inspectors open
Note
Some window managers might disable/hide the close button of floating inspectors. If this happens, you can still close them with a keyboard shortcut (most commonly Alt+F4), or by right-clicking on the title bar and choosing the Close option from the menu that appears.
Opening Inspectors
Inspectors can be opened in various ways: by double-clicking an item in the Object Navigator or in other inspectors; by selecting one of the Open menu items from the context menu of an object displayed in the UI; or via the Find/Inspect Objects dialog (described later). Inspector-related menu items are available in the Inspect menu.
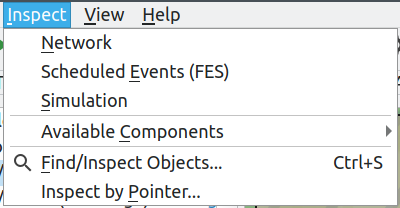
Fig. 115 The Inspect menu
There is also an Inspect by pointer menu item, which allows you to directly enter the C++ pointer of an object as a hexadecimal value. Beware that entering an invalid pointer will crash the simulation. Object addresses can be obtained, for example, by using a debugger.
Navigation History
Inspectors always show some aspect of one simulation object, but they can change which object they display. For example, in the Network View, when you double-click a submodule that is itself a compound module, the view switches to showing the internals of that module. Similarly, the Object Inspector always shows information about the object last clicked in the UI. Inspectors maintain a navigable history: the Back and Forward functions navigate to objects inspected before or after the currently displayed object. Objects deleted during simulation automatically disappear from the history.
Restoring Inspectors
When you exit and restart a simulation program, Qtenv attempts to reopen the inspector windows that were previously open. However, because object identity is not preserved across different runs of the same program, Qtenv relies on the object’s full path, class name, and object ID (if available) to locate and identify the object to be inspected. This approach can occasionally result in misidentification of objects.
Preferences such as zoom level or open/closed state of tree nodes are usually maintained per object type (i.e., tied to the C++ class of the inspected object).
Browsing the Registered Components
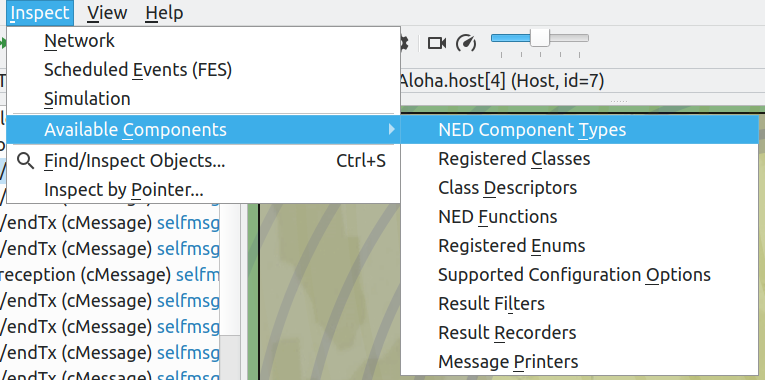
Fig. 116 The Inspect menu
Registered components (NED Types, classes, functions, enums) can be displayed using the menu item. If an error message reports missing types or classes, you can check here whether the missing item is actually available and registered correctly.
Querying Objects
The Find/Inspect Objects dialog allows you to search the simulation for objects that meet specific criteria. These criteria can include the object name, class name, field values, or a combination of these. Class names must be fully qualified (i.e., they should include their namespace(s)), regardless of the related setting in the Preferences dialog. Results are presented in a sortable table, and you can double-click any item to inspect it.
Some possible use cases:
Identifying bottlenecks in the network by examining all queues ordered by length (i.e., sorting the result table by the Info column)
Finding nodes with the highest packet drop count. If drop counts are watched variables (see the
WATCH()macro), you can easily list and sort them.Finding modules that leak messages. If the live message count on the status bar keeps increasing, you can search for all message objects to identify where the leaked messages are accumulating.
Easy access to specific data structures or objects, such as routing tables. You can search by name or class name and use the result list as a collection of shortcuts, eliminating the need to manually navigate the simulation’s object tree.
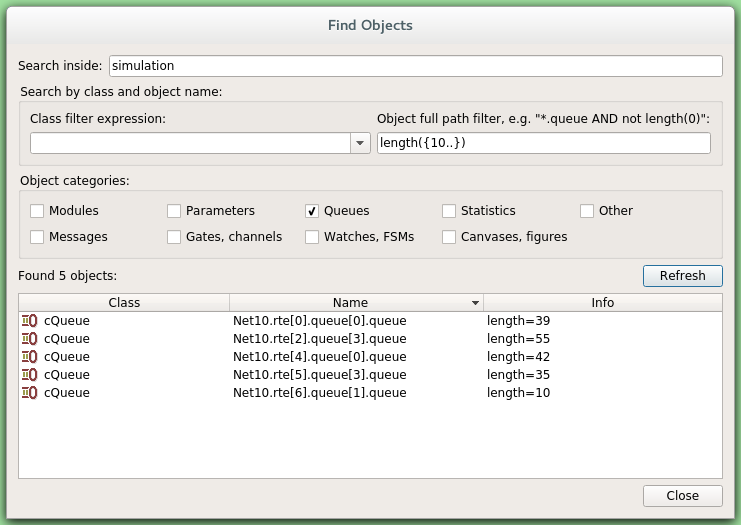
Fig. 117 Using the Find/Inspect Objects dialog to find long queues
The dialog lets you specify the search root, as well as the name and class name of the objects to find. The latter two parameters accept wildcard patterns.
Use the checkboxes in the dialog to select object categories of interest. When you select a category, all objects of that type (and any derived types) will be included in the search. Alternatively, if you specify an object class as a class filter expression, the search dialog will match only objects with that exact class name. Objects of derived types will not be included in this case.
You can also provide a generic filter expression, which by default matches against the object’s full path. Wildcards ("?",
"*") are supported. "{a-exz}" matches any character in the range "a" through "e" plus the characters
"x" and "z". Match numbers using patterns like "*.job{128..191}" to find objects named
"job128", "job129", through "job191". Patterns like "job{128..}" and "job{..191}" are also supported.
Combine patterns using AND, OR, NOT, and parentheses. Lowercase versions of these keywords (and,
or, not) are also accepted. Match other object fields, such as queue length or message kind, using
the syntax fieldname =~ pattern. For patterns containing special characters or spaces, enclose them in
quotes. (HINT: In most cases, start your pattern with "*." to match objects anywhere in the
network!)
Examples:
*.destAddr: Matches all objects with the name"destAddr"(likely module parameters).*.node[8..10].*: Matches anything inside modulenode[8],node[9], andnode[10].className =~ omnetpp::cQueue AND NOT length =~ 0: Matches non-empty queue objects.className =~ omnetpp::cQueue AND length =~ {10..}: Matches queue objects with length greater than or equal to 10.kind =~ 3 OR kind =~ {7..9}: Matches messages with message kind equal to 3, 7, 8, or 9 (only messages have a"kind"attribute).className =~ IP* AND *.data-*: Matches objects whose class name starts with"IP"and name starts with"data-".NOT className =~ omnetpp::cMessage AND byteLength =~ {1500..}: Matches messages whose class is not cMessage and byteLength is at least 1500 (only messages have a"byteLength"attribute)."TCP packet" OR "*.packet(15)": Quotation marks are needed when the pattern is a reserved word or contains whitespace or special characters.
Using Qtenv with a Debugger
You can use Qtenv in combination with a C++ debugger, which is particularly useful when developing new models. Qtenv assists with debugging in several ways:
By triggering debug traps (also known as debug breakpoints) at strategic places, allowing you to debug specific events or error conditions.
By launching an external debugger and attaching it to the simulation process before executing a debug trap. Qtenv detects if a debugger is already attached and, if not, offers to launch and attach one.
By displaying memory addresses of inspected objects, making it easier to examine them in a debugger.
What is a debug trap? A debug trap is a mechanism that pauses program execution at a specific point,
allowing developers to inspect the current program state, including variables, memory, and control flow. When
triggered, it causes the debugger to halt the program, providing an opportunity for detailed
analysis and debugging. This is particularly valuable for identifying and resolving runtime errors,
unexpected behavior, or logic flaws in code. Debug traps are implemented using techniques such as
inserting specific instructions like int3 or SIGTRAP, which debuggers recognize as
breakpoints. When no debugger is attached, a debug trap typically causes the program to abort.
Note
Qtenv is a library that runs as part of the simulation program. Therefore, suspending the simulation program in a debugger will also freeze the GUI until execution resumes. Similarly, if the simulation crashes, it will terminate the entire process, including the Qtenv GUI.
The debugger command line that Qtenv runs can be specified in one of two ways:
The
OMNETPP_DEBUGGER_COMMANDenvironment variable.The
debugger-attach-commandconfiguration option.
The value of these options must be a string containing exactly one %u placeholder, which Qtenv will
replace with the process ID of the simulation.
Qtenv offers the following debugging-related actions:
Debug On Errors
This menu item toggles whether a debug breakpoint is executed when the simulation encounters a
runtime error. This setting corresponds to the debug-on-errors configuration option. The state of this menu item is
reset to the value of debug-on-errors whenever a new simulation starts.
Debug Next Step
Performs one simulation event similar to Step, but executes a debugger trap just before entering the module’s
event handling code (handleMessage() or activity()). This causes the debugger to stop the program at that point,
allowing you to examine state variables, single-step through code, and more. When you resume execution, Qtenv regains control and
becomes responsive again.
Break into Debugger
Triggers a debug trap immediately.
Recording the Simulation
Recording an Event Log
The OMNeT++ simulation kernel allows you to record event-related information to a file, which you can later use to
analyze the simulation run with the Sequence Chart tool in the IDE. Enable eventlog recording
with the record-eventlog=true ini file option, or interactively via the corresponding item in the
Simulate menu or using a toolbar button.
Note that starting Qtenv with record-eventlog=true produces a different eventlog file than enabling recording later.
In the former case, all network setup steps, including module creation, are recorded as
they occur. In the latter case, Qtenv must “fake” a sequence of steps that would produce the current simulation state.
Capturing a Video
When active, this feature saves the main window contents to a subfolder named frames in the working
directory at regular intervals (in animation time). Each frame is saved as a PNG image with a sequential number in its file
name. You must then convert (encode) these images into a video file using an external tool
(such as ffmpeg, avconv, or vlc). When recording begins, an info dialog appears showing
details about the output and providing an example command for high-quality encoding using ffmpeg. The speed slider on the toolbar
also affects the resulting video.
Note
This built-in recording feature produces smoother videos than external screen-capture utilities because it has access to more information and greater control over the process than external tools.
The Preferences Dialog
Select from the menu to open the runtime environment’s configuration dialog. This dialog allows you to customize various display, network layout, and animation options.
General
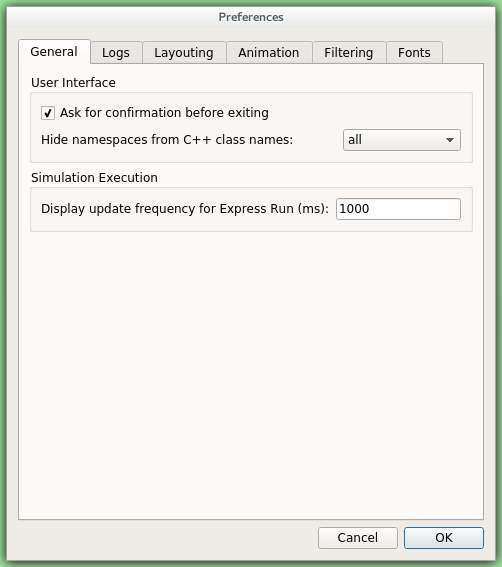
Fig. 118 General settings
Use the General tab to configure default user interface behavior. You can specify whether namespaces should be stripped from displayed class names and how frequently the user interface should update while the simulation runs in Express mode.
Logs
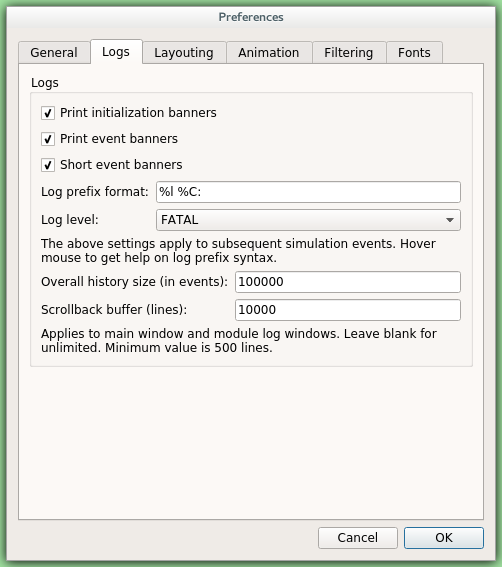
Fig. 119 Logging settings
Use the Logs tab to configure default logging behavior, including the log level for modules that don’t override it, the prefix format for event banners, and the size limit of the log buffer.
Configuring the Layouting Algorithm
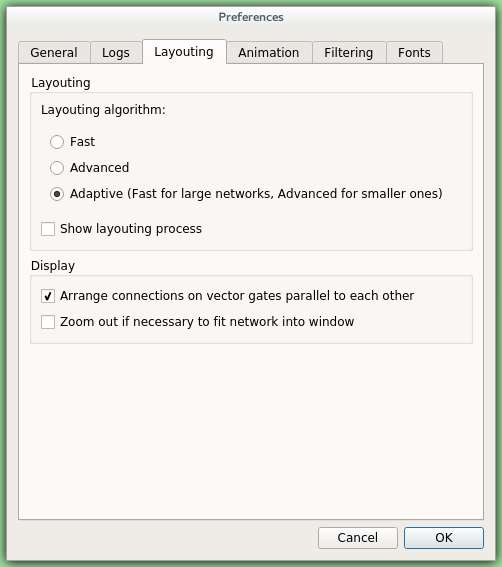
Fig. 120 Layouting settings
Qtenv automatically arranges submodules that don’t have locations specified in their NED files. You can fine-tune this layout algorithm on the Layouting page of this dialog.
Configuring Animation
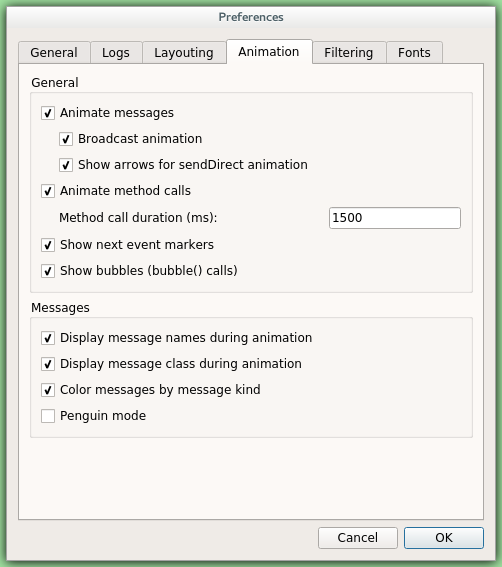
Fig. 121 Animation settings
Qtenv provides automatic animation during simulation runs. Fine-tune these animation settings using the Animation page of the preferences dialog. If you don’t need all the visual feedback that Qtenv provides, you can selectively disable specific features:
Animate messages: Enables/disables visualization of messages passing between modules.
Broadcast animation: Provides special handling for message broadcasts (zero-time messages sent within the same event are animated concurrently).
Show next event marker: Highlights the module that will receive the next event.
Show a dotted arrow when a
sendDirect()method call executes.Show a flashing arrow when a method call occurs between modules. The call is only animated if the called method contains the
Enter_Method()macro.You can also disable the display of message names and classes.
Timeline and Animation Filtering
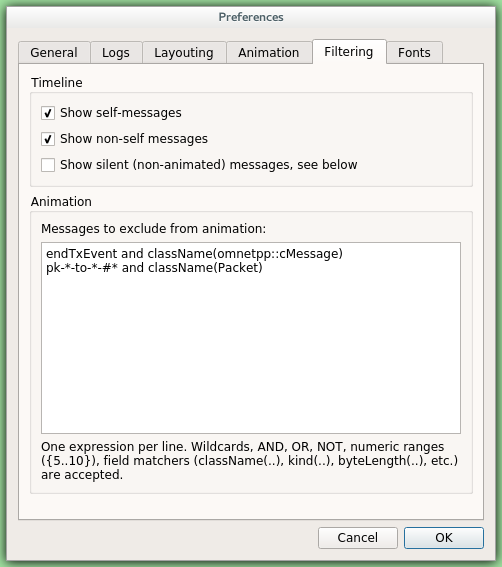
Fig. 122 Filtering
The Filtering page of the dialog serves two purposes. First, it lets you filter the contents of the Timeline. You can hide all self-messages (timers) or all non-self messages. You can also reduce the number of messages shown on the timeline by hiding non-animated messages, as explained below.
Second, you can suppress animation for specific message types. For example, when focusing on routing protocol messages, you can suppress animation of data traffic messages.
The text box allows you to specify multiple filters, each on a separate line. Filter messages by name, class name, or any other property that appears in the Fields page of the Object Inspector when examining the message object.
Note
When you select Exclude Messages Like ‘x’ From Animation from a message object’s context menu, it automatically adds a new filter to this dialog page.
For object names, you can use wildcards ("?", "*"). "{a-exz}" matches any character in the range "a"
through "e" plus the characters "x" and "z". Match numbers with patterns like "job{128..191}" to
match "job128", "job129", through "job191". Patterns like "job{128..}" and
"job{..191}" are also supported. Combine patterns using AND, OR, NOT, and parentheses. Lowercase versions of these
keywords (and, or, not) work as well. Match against other object fields, such as message
length or message kind, using the syntax fieldname =~ pattern. Enclose patterns containing special characters or
spaces in quotes.
Examples:
m*: Matches any object whose name begins with “m”.m* AND *-{0..250}: Matches any object whose name begins with “m” and ends with a dash and a number between 0 and 250.NOT *timer*: Matches any object whose name does not contain the substring “timer”.NOT (*timer* OR *timeout*): Matches any object whose name contains neither “timer” nor “timeout”.kind =~ 3 OR kind =~ {7..9}: Matches messages with message kind equal to 3, 7, 8, or 9.className =~ IP* AND data-*: Matches objects whose class name starts with “IP” and name starts with “data-“.NOT className =~ omnetpp::cMessage AND byteLength =~ {1500..}: Matches objects whose class is not cMessage and whose byteLength is at least 1500."TCP packet" OR "*.packet(15)": Quotation marks are needed when the pattern is a reserved word or contains whitespace or special characters.
Models can also programmatically control animation through a per-module setting that prevents animations when
inspecting a specific module (setBuiltinAnimationsAllowed()).
Configuring Fonts
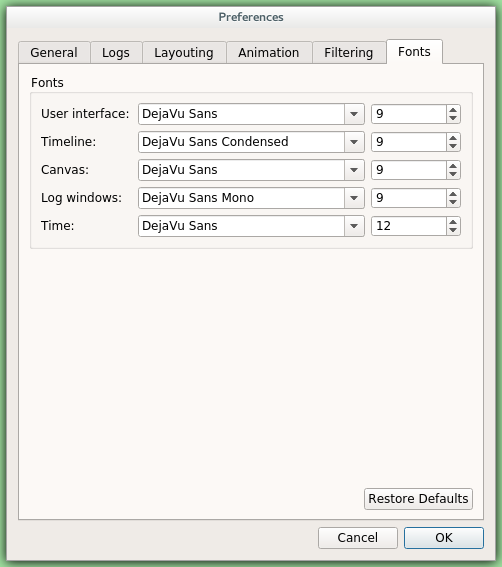
Fig. 123 Font selection
The Fonts page of the settings dialog lets you select the typeface and font size for different user interface elements.
The .qtenvrc File
Settings are stored in .qtenvrc files. Two such files exist: one in the current directory containing
project-specific settings (such as the list of open inspectors), and another in the user’s home directory
containing global settings.
Note
Inspectors are identified by their object names. If multiple components share the same name (common with
messages), you may see numerous inspector windows when starting the simulation. In
such cases, simply delete the .qtenvrc file to resolve this issue.
Qtenv and C++
This section describes the C++ API functions that different parts of Qtenv use to display data and perform their functions.
Most of these are member functions of the cObject class.
Inspectors
Inspectors display the hierarchical name (full path) and class name of the inspected object in the title using the
getFullPath() and getClassName() member functions of cObject. The Go to parent feature
uses the getOwner() method of cObject.
The Object Navigator displays each object’s full name and class name (using getFullName() and
getClassName()), plus the ID for classes that have one (getId() on cMessage and cModule). When
hovering over an object, the tooltip shows the info string (from the str() method). The tree roots are the network
module (simulation.getSystemModule()) and the FES (simulation.getFES()). Child objects are enumerated using
the forEachChild() method.
The Object Inspector in Children mode displays the full name, class name, and info string
(getFullName(), getClassName(), str()) of child objects enumerated using forEachChild().
forEachChild() can only enumerate objects that are subclasses of cObject. To make non-cObject variables
(e.g., primitive types or STL containers) appear in the Children tree, you must wrap them in
cObject. The WATCH() macro does exactly this: it creates an object wrapper that displays the variable’s value
via the wrapper’s str() method. Special watch macros exist for STL containers; these present the wrapped object to
Qtenv in a more structured way using custom class descriptors (cClassDescriptor, see below).
One might wonder how the forEachChild() method of modules can enumerate messages, queues, and other objects owned by
the module. The module class maintains a list of owned objects, and cObject automatically joins
that list when created within the module’s context.
The Object Inspector displays an object’s fields using the class descriptor
(cClassDescriptor) for that class. Class descriptors are automatically generated for new classes by the message
compiler. Class descriptors for the OMNeT++ library classes are also generated by the message compiler (see
src/sim/sim_std.msg in the source tree).
The Network Display uses cSubmoduleIterator to enumerate submodules, and its Go to parent
module function uses getParentModule(). Background and submodule rendering is based on display strings
(the getDisplayString() method of cComponent).
Log Viewer
The module log page of Log Viewer displays output from EV streams of modules and channels.
The log viewer supports basic formatting (including colors) via ANSI escape sequences.
The message/packet traffic page of Log Viewer shows information based on stored copies of sent messages (created
using dup()) and stored sendhop information. The Name column displays the message name
(getFullName()). The Info column, however, does not display the string returned from str(), but
instead shows strings produced by a cMessagePrinter object. Message printers can be dynamically registered to customize
this display.
During Simulation
Qtenv sets up a network by calling simulation.setupNetwork(), then immediately invokes
callInitialize() on the root module. During simulation, simulation.takeNextEvent() and
simulation.executeEvent() are called iteratively. When the simulation ends, Qtenv invokes callFinish() on the
root module; this also happens when you select the Conclude Simulation menu item. The purpose of
callFinish() is to record summary statistics at the end of a successful simulation run, so it’s skipped if an
error occurs during simulation. Before setting up a new network or exiting, simulation.deleteNetwork() is called.
Animation
To refresh the visual representation of the simulation, Qtenv regularly invokes simulation.callRefreshDisplay(),
which in turn calls the refreshDisplay() methods of modules and figures. These refreshDisplay() methods are
defined as part of the simulation model and typically update display strings and/or move, update, create, or
delete figures on module canvases.
refreshDisplay() is invoked after each simulation event, or at a specific frame rate when smooth animation is
enabled. The frame rate during smooth simulation adapts dynamically. You can control various animation properties through
settings in the Animation Parameters dialog. For more information about smooth animation, see the corresponding
section in the Simulation Manual.
Extending Qtenv
Users can contribute new inspector types without modifying Qtenv’s source code. To do this, the inspector C++ code must include Qtenv header files and link with the Qtenv library. Note that Qtenv headers are not considered public API and may change in future versions of OMNeT++.
Command-line and Configuration Options
Command-Line Options
A simulation program built with Qtenv accepts these command-line switches:
-h: Prints a help message and exits.-u Qtenv: Starts the program with Qtenv (this is the default, unless the program wasn’t linked with Qtenv or has another custom environment library with higher priority).-f filename: Specifies the configuration file name. The default isomnetpp.ini. Multiple-fswitches can be used, allowing you to partition your configuration. For example, one file might contain general settings, another might contain most module parameters, and a third might contain frequently changed module parameters. The-fswitch is optional.-l filename: Loads a shared library (.sofile on Unix,.dllon Windows, and.dylibon macOS). Multiple-lswitches are accepted. Shared libraries may contain simple modules and other code. File names can be specified without the file extension and thelibname prefix (e.g.,fooinstead oflibfoo.so).-n filepath: Overrides theNEDPATHenvironment variable and sets the source locations for simulation NED files.-c configname: Selects a specific INI configuration for execution.-r runnumber: Has the same effect as (but takes priority over) the qtenv-default-run= INI file configuration option. Run filters are also accepted. When multiple runs match, they are grouped at the top of the selection combobox.
Environment Variables
OMNETPP_IMAGE_PATH: Controls where Qtenv loads images for network graphics (modules, backgrounds, etc.). The value should be a semicolon-separated list of directories (on non-Windows systems, colons are also accepted as separators). The default is./bitmaps;./images;<omnetpp>/images, meaning Qtenv searches thebitmapsandimagesfolders of the simulation, as well as theimagesfolder in your installation’s working directory. Directories are scanned recursively, with subdirectory names becoming part of the icon name. For example, if animages/directory is listed, the fileimages/misc/foo.pngwill be registered as an icon namedmisc/foo. Qtenv supports PNG, JPG, and GIF files.OMNETPP_DEBUGGER_COMMAND: When set, overrides the default command used to launch the just-in-time debugger (debugger-attach-command). It must contain ‘%u’ (which will be replaced with the process ID of the simulation) and should not contain any additional ‘%’ characters. Since the command needs to return immediately, on Linux and macOS systems, it’s recommended to end it with an ampersand (’&’). Settings specified on the command line or in an.inifile take precedence over this environment variable.
Configuration Options
Qtenv accepts these configuration options in the INI file:
qtenv-extra-stack: Specifies the extra stack space (in kilobytes) reserved for eachactivity()simple module when running the simulation under Qtenv. This value is significantly higher than the equivalent setting for Cmdenv because handling GUI events requires substantial stack space.qtenv-default-config: Specifies which INI file configuration Qtenv should automatically set up at startup. If not specified, Qtenv will prompt you to select a configuration.qtenv-default-run: Specifies which run of the selected configuration Qtenv should set up at startup. If not specified, Qtenv will prompt you to select a run.
All other settings can be adjusted through the GUI and are saved in .qtenvrc files.